You have a stack of exams with a class average of 52%, and you need to adjust them so half the class doesn't fail. Finding the right formula that is fair to every student is a real headache. This calculator helps you automatically apply four standard test curving methods to your class grades. Over 15,000 educators use these exact curving methods to handle raw exam scores fairly.
How do you curve test scores fairly?
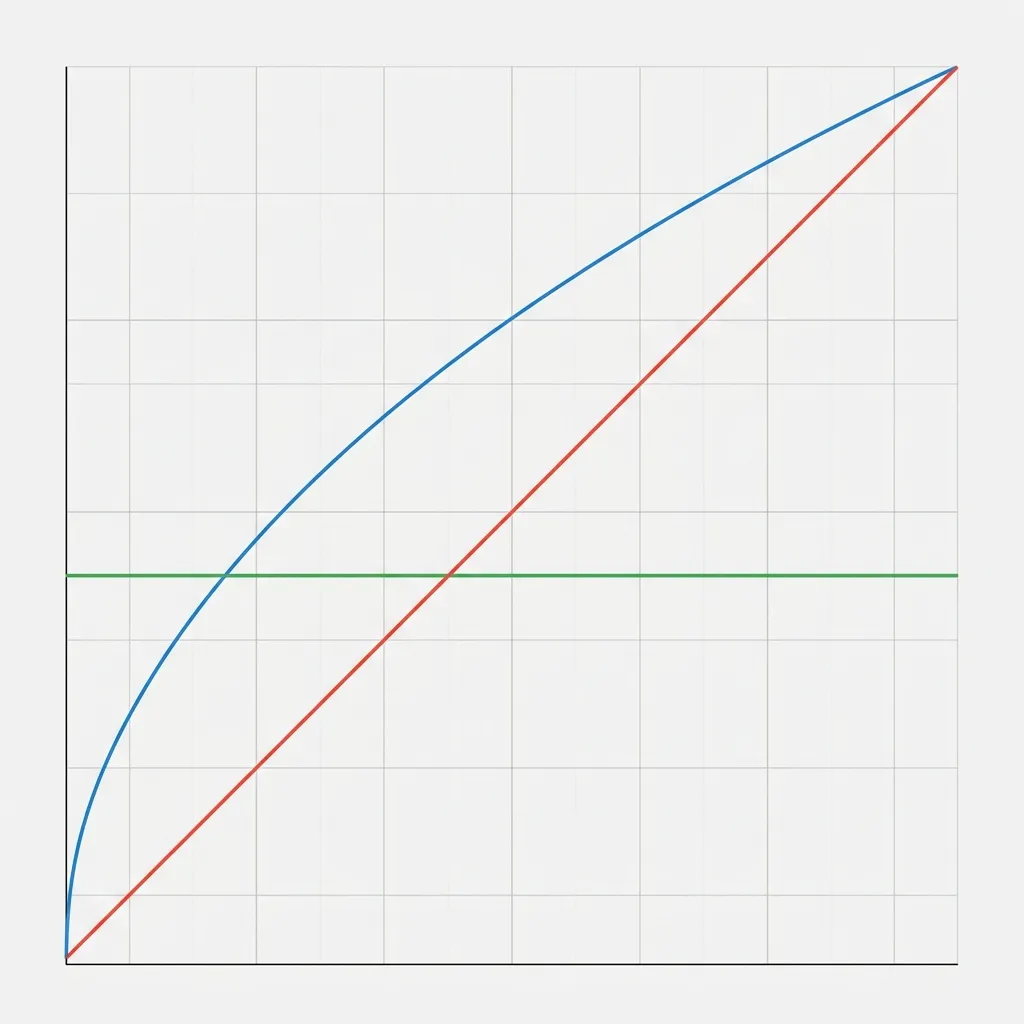
You curve test scores fairly by selecting a method that matches your class's overall grade distribution. If most students scored poorly, a **square root curve** or **linear scale curve** is usually the most equitable choice.
These methods help raise the lowest grades without pushing the top-performing students past the maximum score of 100%.
For example, on a square root curve, a student who earned a 64% will see their grade jump to 80%. But a student who earned a 90% only goes up to 94.8%. This distribution naturally compresses the range of scores while helping struggling students pass the exam.
What are the best test grading curve methods?
The best test grading curve methods include the square root curve, flat point additions, and linear scaling. Teachers select these curves based on how the class performed as a whole.
Here is a breakdown of the three most popular curving methods:
- Square Root Curve: Calculates the square root of the score and multiplies by 10. It is highly popular because it heavily boosts failing grades.
- Flat Point Curve: Adds a set number of points (like 5 or 10) to everyone's grade. It is the easiest to calculate but can push top scores past 100%.
- Linear Scale: Maps the lowest class grade to a new minimum (like 60%) and the highest grade to a new maximum (like 95%).
Step-by-Step Instructions
- 1Input your students' raw test scores separated by commas or new lines.
- 2Select one of the four curving methods: Sqrt, Flat, Percentage, or Linear.
- 3Adjust the points, percentages, or target ranges using the slider controls.
- 4Compare the original and curved class averages on the summary dashboard.
- 5Download the final grade sheet as a CSV file to import into your gradebook.